IELTS Writing Academic Task-1 Line graph📈 | Band 9 example, Vocabulary & Tips
In the IELTS Writing Academic Task-1 Line graph, you are presented with visual information in the form of a graph that you need to describe in 150 words.
You only have 20 minutes to finish this task, so practice reading and understanding the line graph quickly.
In this article, We have covered the most important aspects of a line graph question i.e What is a line graph? how do you describe a line graph? what kind of vocabulary is to be used? how you can score band 7 and above in the line graph?
So, let’s get started…
What is a line graph?
A line graph, sometimes called as a line chart or linear graph, is the visual representation of change in a quantity with respect to another quantity. This change is usually plotted in a two-dimensional XY plane.
It is always important to read what is defined on each axis. This is because the visual information you are given in the IELTS Writing Academic Task-1 line graph often asks you to compare or contrast different information given on X and Y axis.
How do you describe a line graph in IELTS?
To describe a line graph, Follow this step-by-step structure that can fetch you high band scores in IELTS Writing Academic Task 1:
- Analyse the line graph and identify 2-4 main features.
Spend starting few minutes (2-3 mins maximum) to understand the visual of the line graph and the data it shows.
- Paraphrase the statement.
This will be your introductory paragraph for the line graph. Write a concise description of the figure in your own words.
- Write an overview.
This will be your second paragraph where you will write the main features (which you’ve identified in the 1st step) of the line graph in order to establish trends or patterns in the data.
- Write detailed Body Paragraph.
In the third paragraph, you will make detailed comparisons between given data sets and/or describe individual features presented in the line graph. You will be using the statistics given in the figure to write a descriptive response.
- Write a summary paragraph.
This will be your last paragraph where you will write conclusive remarks about the line graph.
To learn more about the implementation of this 5-step structure, have a careful look at the band 9 examples written below.
IELTS Writing Academic Task-1 Line graph: Band 9 example
You should spend about 20 minutes on this task.
| The line graphs below show the numbers and the percentages of children (aged 0-14 years) and young people (aged 15-24 years) in the French population from 1958 till present, and projections until year of 2038. Select and report the main features while summarising the information, and make comparisons where relevant. |
Write at least 150 words.
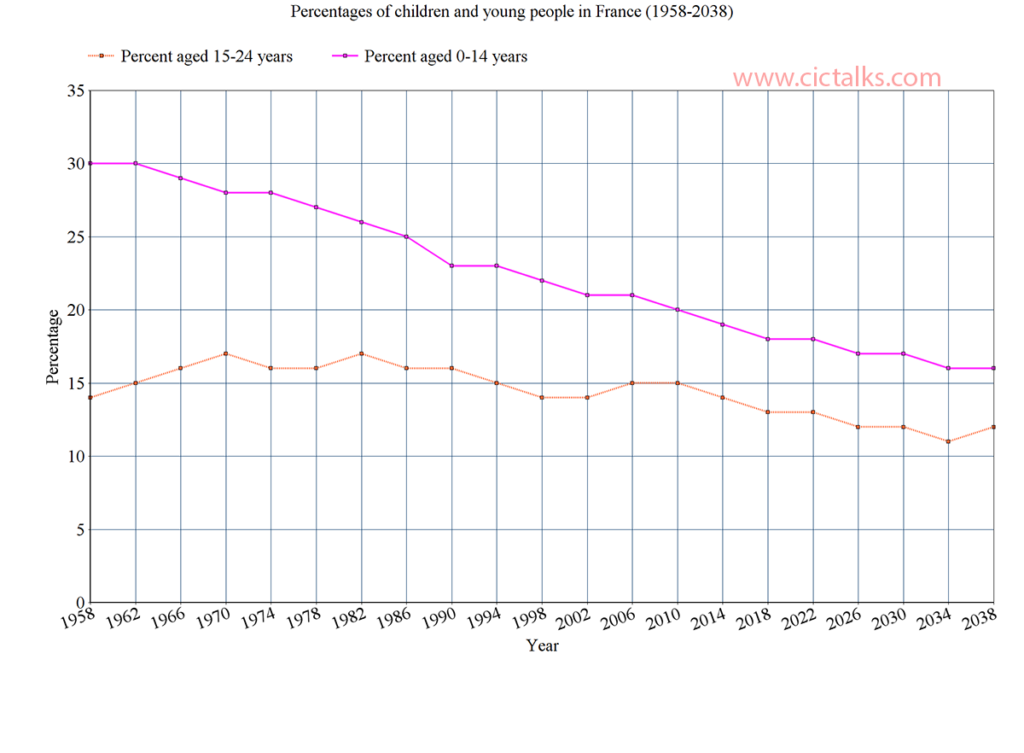
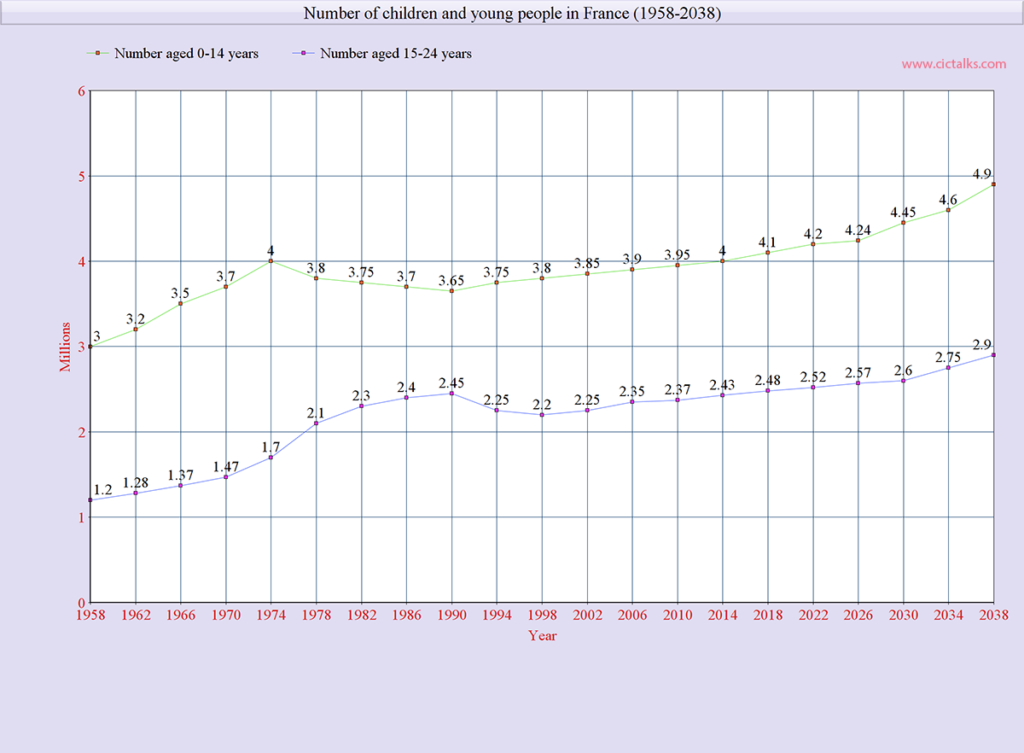
The two line graphs illustrate the total population and percentage distribution of children and youngsters in France during the period of 1958 to 2038.
There has been fall in percentage of the French population who are children since 1958, and that percentages of children and young people are forecasted to decrease between now and the year 2038.
The percentage of children aged 0-14 has fallen from the peak of 30% in 1958, and it is projected to fall gradually till 2038. Whereas, the proportion of 15-24 year olds grow approximately 17% in 1980, but has dropped gradually since then. It is projected that this group will make up just 12% of the total French population by the end of such 80-year period. However, the number of children and youngsters have risen since 1958, except for a short decline. By the year 2038, it is expected that there will be 5.2 million children and 3.8 million youngsters in total French population.
Overall, it can be seen that French people has aged since 1958 and this trend is expected to continue into the future.
✅ The introduction is nicely paraphrased with some general statements about the information shown by the line graph.
✅ The second paragraph presented an overview of the data with key features.
✅ The third paragraph looked at the numbers and percentages. Trends and data have been included and relevant comparisons have been made between two age groups.
✅ Use of cohesive devices: however and whereas.
✅ Range of vocabulary : fall, decreased, dropped, risen, grown, increased, projected, forecasted.
✅ There is good use of passive voice, simple past, present perfect and future tenses.
✅ There are 183 words.
This is a well written response to the task and deserve high band scores.
IELTS Writing Academic Task-1 Line graph: Useful Vocabulary
The examiner will use different parameters to assess your line graph, and one such parameter is Lexical Resource. It is about the accuracy and range of the vocabulary that you use.
Below, I’ve provided you with a full-fledged list of useful nouns, adjectives, adverbs, phrases, prepositions and many more that I’ve used during my preparation.
Make sure you remember at least 3-4 words from each category so that you are able to impress the examiner with your range of words.
You could also use a ‘corpus’ to look at how these words are actually used in everyday sentences. Simply type the word you are searching for and voila..you will have lots of example sentences, pretty cool, right..?
| Nouns & Verbs |
|---|
| GOING UP ➡️ growth, increase, surge, rise, boom, peak |
| GOING DOWN ➡️ decline, decrease, dip, reduction, plummet, plunge, drop, fall, slump |
| GOING UP & DOWN ➡️ variation, undulation, fluctuation |
| NO CHANGE ➡️ period of stability, plateau |
| Adjectives |
|---|
| SMALL CHANGE ➡️ modest, minor, gradual, negligible, slight, moderate, marginal, gentle |
| LARGE CHANGE ➡️ significant, vast, considerable, dramatic, steep, great, marked |
| QUICK CHANGE ➡️ sharp, rapid, sudden |
| Adverbs |
|---|
| SMALL CHANGE ➡️ slightly, modestly, marginally, moderately, gradually, negligibly |
| LARGE CHANGE ➡️ significantly, vastly, considerably, dramatically, steeply, greatly, markedly |
| QUICK CHANGE ➡️ sharply, rapidly, suddenly |
| Prepositions |
|---|
| __________in 2020 |
| __________in May |
| __________from 2020 to 2021 |
| __________by 1995 |
| __________over a 5 year period |
| __________between 2005 and 2008 |
| __________an increase of 15% |
| __________decreased by 20% |
| __________fell from 14% to 11% |
| __________rose sharply over a period of 7 years |
| Fractions & Proportions |
|---|
| 05% ➡️ a tiny proportion / an insignificant minority |
| 15% ➡️ a small minority |
| 25% ➡️ one quarter |
| 35% ➡️ nearly one-third |
| 48% ➡️ just under a half |
| 50% ➡️ exactly a half |
| 52% ➡️ just over a half |
| 71% ➡️ a large proportion / a significant majority / nearly three quarters |
Example structures:
| 🏷 Noun phrase + verb + adverb a) The price of car fell sharply. b) The percentage of vaccines dropped dramatically. 🏷 There + be + noun + preposition + noun phrase a) There has been an increase in the consumption of tea. b) There was a drop in gasoline prices. 🏷 There + be + adjective + noun + preposition + noun phrase a) There has been a sharp decline in the consumption of tea. b) There was a gradual rise in the production of oil. |
Important Tips for Line Graphs
#1 Choose the actual key features:
When you analyse the line graph always remember that ‘key features’ does not mean just any random information from the visual data. It means that you have to study and interpret the main trends that the line graph is showing.
So, take your time to understand the line graph thoroughly.
#2 ‘Overview’ paragraph is a MUST:
Write a short overview of the main information you identified in the line graph. Candidates often overlook this step and loose band scores as a result.
It is very important to give one-sentence overview of the main trends in the line graph. You will not achieve a good ‘Task Achievement’ score if you miss out on this.
#3 Make use of synonyms:
Synonyms are a great tool to write the same information presented in the question statement but differently.
Therefore, whenever you think of good synonyms for the words in the statement, apply them, it will show the examiner that you have good a range of vocabulary.
#4 No need to write specific numbers:
IELTS is a clever test especially in line graphs, where it becomes hard to figure out what the exact numbers are.
In such conditions, it is better to use the words such as – approximately, nearly, just above or just under; rather than writing specifics. It also demonstrate your English analytical skills.
#5 Follow the 5-step structure:
Always make sure that your line graph description is logically structured. If you do not adhere to this, it can be very hard for the examiner to gain a clear perception of what you have described.
For your ease, I recommend using and practising writing with the help of 5-step line graph structure explained above. If you practice this enough, it will be ingrained into your brain, and you won’t miss out any important steps during the exam.
Conclusion
The 5-step line graph writing process is a proven strategy in IELTS Writing Academic Task 1, and when you couple your answer with some good piece of vocabulary and implement the tips shared above you will definitely touch band 7 and above in the task.
I hope you find this article “IELTS Writing Academic Task-1 Line graph📈 | Band 9 example, Vocabulary & Tips” useful. Please do check our similar articles on Bar charts, Pie charts, Maps, Tables and Process diagrams.
If you have any doubts, please write down in the comment section below or mail us at help@cictalks.com.
Wish you best of luck in your exam.
Happy learning !!
![Detour - IELTS Speaking/Writing Vocabulary Word List [PDF]](https://cictalks.com/wp-content/uploads/2021/10/detour-ielts-vocabulary-390x205.png)