IELTS Writing Academic Task 1 ‘Bar chart📊’ – The 5-Step Writing Formula
IELTS Writing Academic Task 1 is completely different to the IELTS General Writing Test. Here, you will be asked to summarise visual data (bar chart in this case) into a minimum of 150 words coherent response.
In this article, I’m going to show you my 5-Step bar chart writing formula and how to use this strategy to achieve good band scores in Writing Task 1.
Also, there’s a band 8 sample task 1 written at the end that will help you to understand what examiner expect from an academic candidate.
But before we dive in, I strongly advise my fellow candidates to spend 20 minutes on task 1 which leaves you with 40 minutes to write task 2 response. Task 2 has more weightage than Task 1.
Now let’s get started …
What is Bar chart ?
A bar chart, in simple terms, is the categorical presentation of data in the form of rectangular bars. It can also be referred to as bar graph in some cases.
The height of rectangular bars is proportional to the values they’ve been assigned.
It has two axis: ‘X-axis’ and ‘Y-axis’, which typically shows comparison of data and change in value of measured variable(s) over a course of time.
5-Step Bar Chart Writing Formula
Follow this step-by-step formula to produce well organised summaries that can fetch you high band scores:
| 1. Analyse the bar chart and identify 2-4 main features. Spend starting few minutes (2-3 mins) to understand the visual and the data it shows. |

| 2. Paraphrase the statement. This will be your introductory paragraph. Write a concise description about the bar chart in your own words. |
| 3. Write an overview. This will be your second paragraph where you will write main features (you’ve identified in the 1st step) of the bar chart in order to establish trends or patterns in the data. |
| 4. Write detailed Body Paragraph. In third paragraph, you will make detailed comparisons between given data sets and/or describe individual features presented in the bar chart. You will be using the information given in the form of numbers and figures to write a descriptive response. |
| 5. Write a summary paragraph. This will be your last paragraph where you will write conclusive remarks about the bar chart. |
To learn more about the implementation of this 5-step writing formula, have a careful look at band 8 task 1 writing sample given below.
IELTS Writing Academic Task 1 – Sample answer
You should spend about 20 minutes on this task.
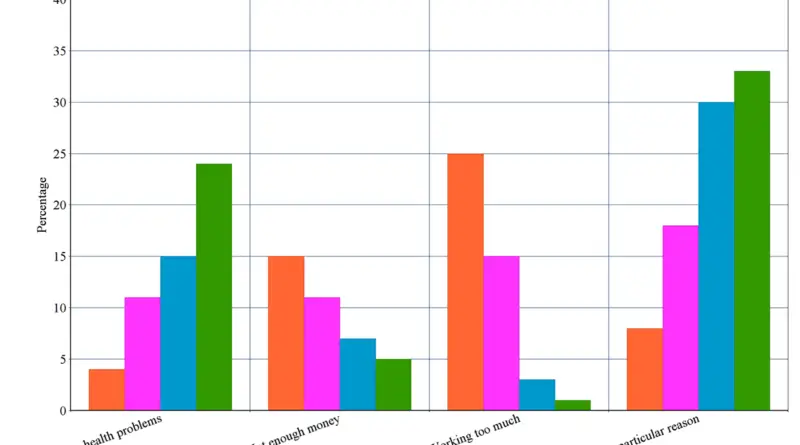
The bar chart below shows the causes of stress for different age groups in Denmark.

Summarise the information by selecting and reporting the main features, and make comparisons where relevant.
Write at least 150 words.
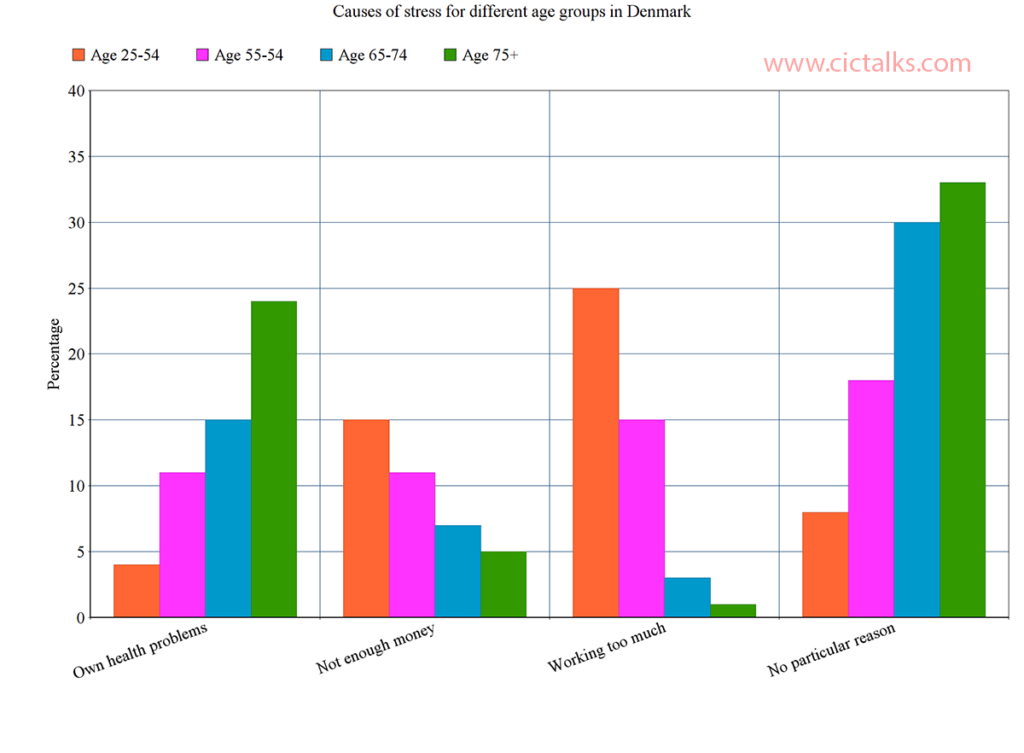
| SAMPLE ANSWER The rendered bar chart reveals the causes of stress change at different phases in lives of people in Denmark. Overall, working too much is identified as the predominant cause of stress by overwhelmingly 27% of people in the age group 25 to 54 years, and by around 15% of those aged 55 to 64 years. However, this is in clear contradiction to the group of Denmark residents aged 65 to 74 and 75+ years, of whom only 2% and 1% respectively rate working too much as the major source of stress. Health problems are directly proportional to age i.e. they increase as a stress factor as people get older. It is the main cause of stress for 4% of youngsters aged 25 to 54, but 24% for age group 75 and above. On the other hand, not having enough money falls from 15% to 5% as the cause of stress for different age groups. No particular reason is by far the number one cause of stress (above 30%) for people aged 65 and over. To summarise, the bar chart illustrate that as people in Denmark get older, some sources of stress such as health grows in importance, whereas others such as working too much and lack of money become less important. |
NOTES

✅ Look at how the first paragraph makes a brief statement about the information contained in the bar chart. All you need to do use synonyms and paraphrasing as much as possible

✅ The following two paragraphs provide overview of the key features and describe the four main causes of stress in different age groups.

✅ The main points have been articulated very well and some comparisons have also been made.

✅ Also observe how the cause of stress has been paraphrased as source of stress and stress factor. This shows the examiner that you've good range of vocabulary.

✅ There has been present tense used through out and there is some use of passive voice.

✅ Look at how this task has been accomplished keeping in view the examiner's writing assessment criteria.

✅ There are 190 words. (>150 words)
Conclusion
The 5-step bar chart writing process is a proven strategy to score band 7+ in IELTS Writing Academic Task 1. The more you practice this process, the less silly mistakes you will be making in the examination.
Also, don’t forget to check your summary at the end for errors. This is really important !
I hope you find this article “IELTS Writing Academic Task 1 ‘Bar chart📊’ – The 5-Step Writing Formula” useful. Please do check our similar articles on Pie chart, Line graph, Map, Table and Process diagram.
If you have any doubts, please write down in the comment section below or mail us at help@cictalks.com.
Wish you best of luck in your exam.
Happy learning !!